As a business owner or manager, have you ever questioned why your business receives first-time customers every so often, but the profits remain stagnant? Why does the increase in customer base not translate to more profits? Could your business be suffering from the Leaky Bucket concept? Well, it may be time to identify and seal the leaks before your bucket empties.
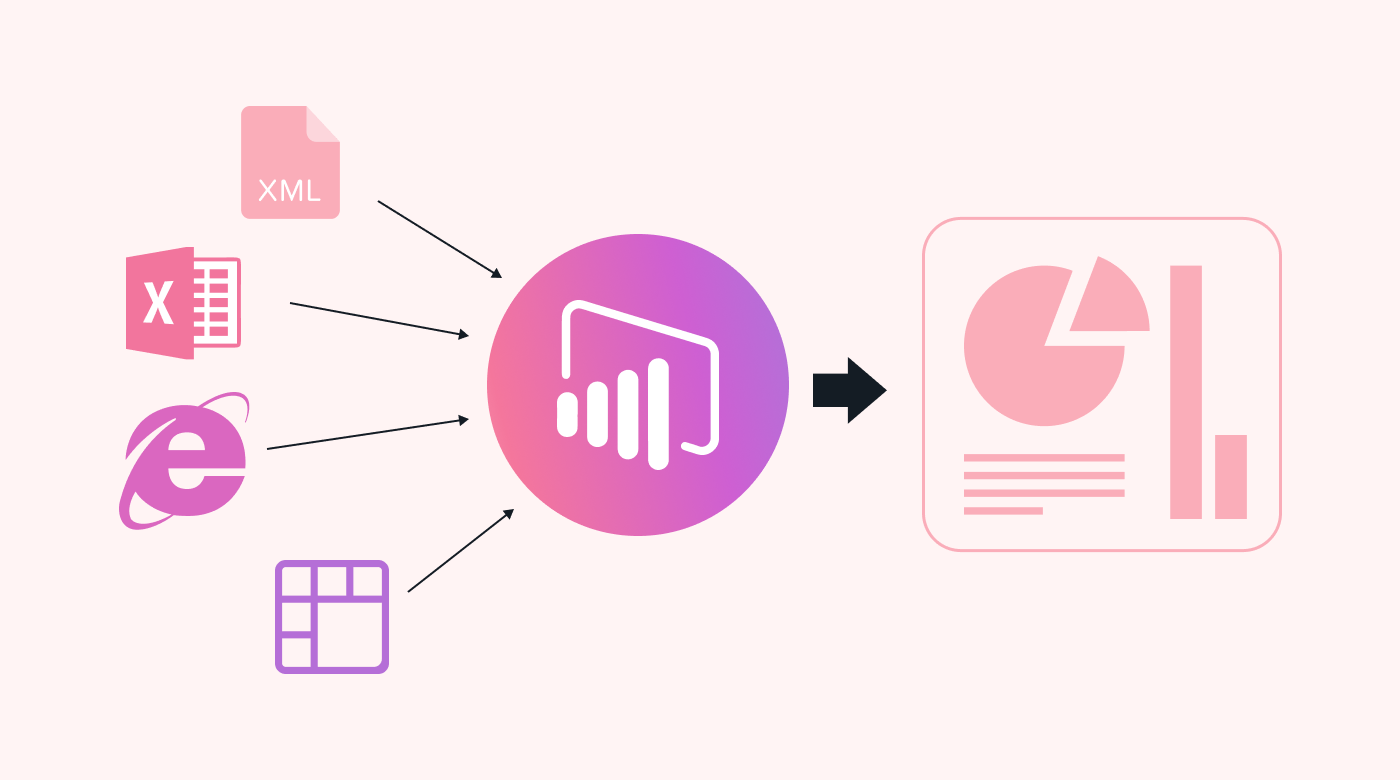
Business intelligence (BI) allows a company to analyze and process its data to identify inefficiencies and guide future decisions regarding process improvement. It aims to make sense of past data to determine a company’s status and establish effective future strategies. Unlike in the past, businesses can now use BI tools to consolidate data from different sources, organize the data, and generate data-backed insights.
Unfortunately, very few businesses have integrated BI tools into their operations. A recent survey shows that only 20.6% of businesses have a data culture and use data-driven processes. This shows many businesses are missing out on the benefits and implementation of BI tools in business operations.
As such, in this article, we’ll cover:
- What is business intelligence
- What are BI tools
- The relationship between BI tools and managing a business
- The benefits of using BI tools
- The common challenges businesses face with BI tools
- How to choose the right BI tools
- The best business intelligence software on the market
What is business intelligence?
Business intelligence (BI) entails a technology-driven process of gathering and analyzing data to drive decision-making. The BI team receives the data, often in its crude form. They then organize, analyze, and interpret the data. Next, the BI team should furnish the C-suite execs with actionable insights to guide strategies and policy-making.
In lay terms, BI involves making sense of the data. Having data you don’t understand is almost the same as having no data at all. A good analogy for understanding BI is using the example of a watch. Suppose you give an expensive analog watch to someone who can’t read it. The watch may be just a bracelet for such a person. Only when they can read the time will they unlock the watch’s true value.
 |
An example of a business that leveraged BI to scale its growth is Baylis & Harding, a UK-based luxury beauty brand. The company’s growth curve had plateaued. This was even after spending significant amounts promoting the brand.
Baylis & Harding adopted BI tools to change how they visualized data. Top-level managers now have instant access to business data. This allows them to adjust business strategies proactively to make the most of customer and market trends.
Relationship between business intelligence and managing a business or project
Project managers and small business owners can use BI to improve performance. One way to improve performance is by identifying and addressing inefficiencies. BI teams can use descriptive analytics to identify a company’s strengths and weaknesses.
Descriptive analytics rely on past or real-time data to explain past or current performance. The BI team may then identify weak areas within a company’s processes. These provide opportunities for improvement.
A successful descriptive analytics phase provides a basis for prescriptive analytics. It seeks to answer the question: What should we do? The BI team may run simulations and decision models to assess possible outcomes for various scenarios and submit recommendations.
Lastly, businesses may run predictive analytics to project possible outcomes. Common BI operations during predictive analytics include:
- Data mining
- Predictive modeling
- Machine learning
The BI team would then communicate their findings to C-suite execs to help them create data-driven strategies.
Benefits of business intelligence tools
Small business owners stand to gain the most from adopting business intelligence. Usually, no two businesses use BI the same way. BI processes should be tailored to match a company’s needs. At a general level, businesses benefit from using BI tools in the following ways:
Effective reporting and communication
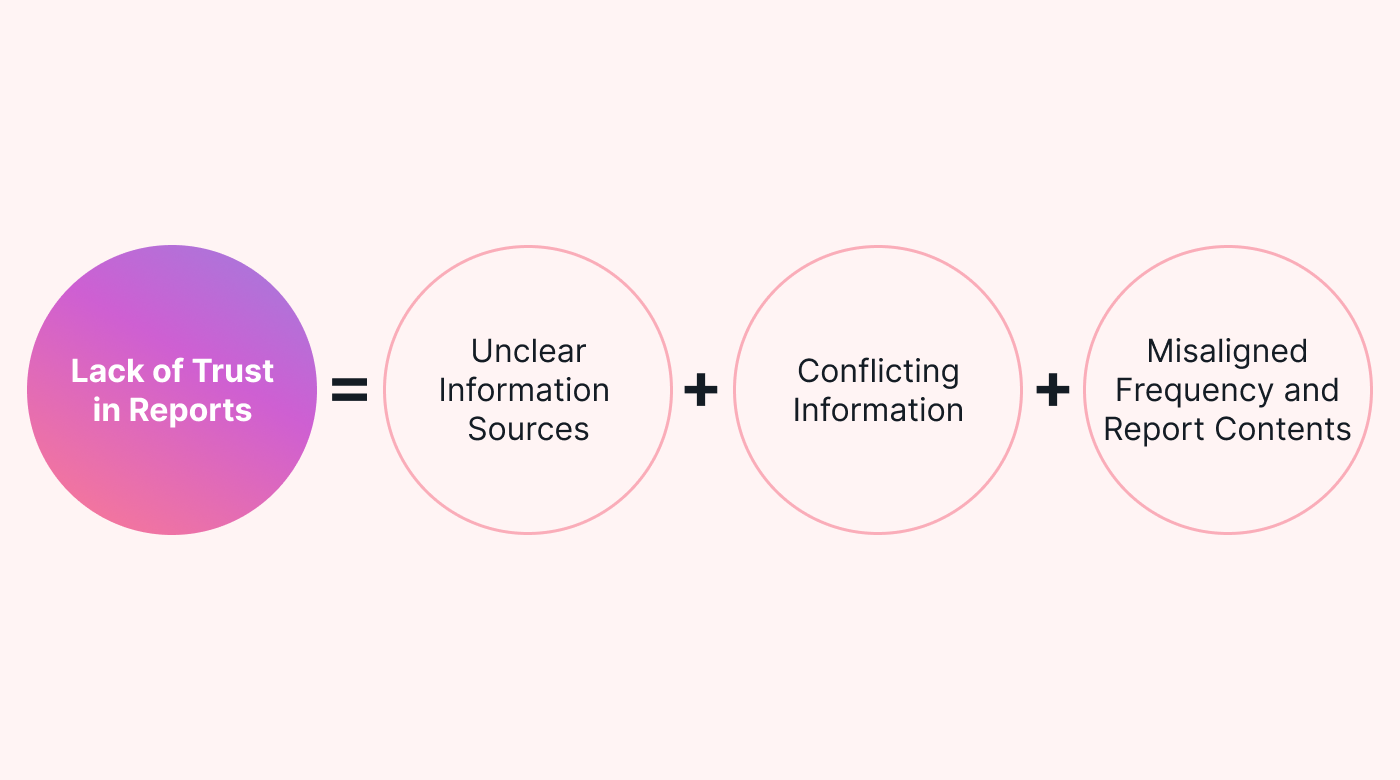
Companies use executive reports to communicate important information to top-level managers and relevant stakeholders. The executive reports should be accurate and timely as they directly affect decision-making. Also, the executive reports should only include information relevant to the recipients or intended purpose.
Make informed business decisions
Businesses can use BI tools to identify decisions that offer the best outcomes. They can do this through predictive or prescriptive analytics. The BI team can also run several optimizations and simulation models for different scenarios. They can then identify which improvements offer the best success rates.
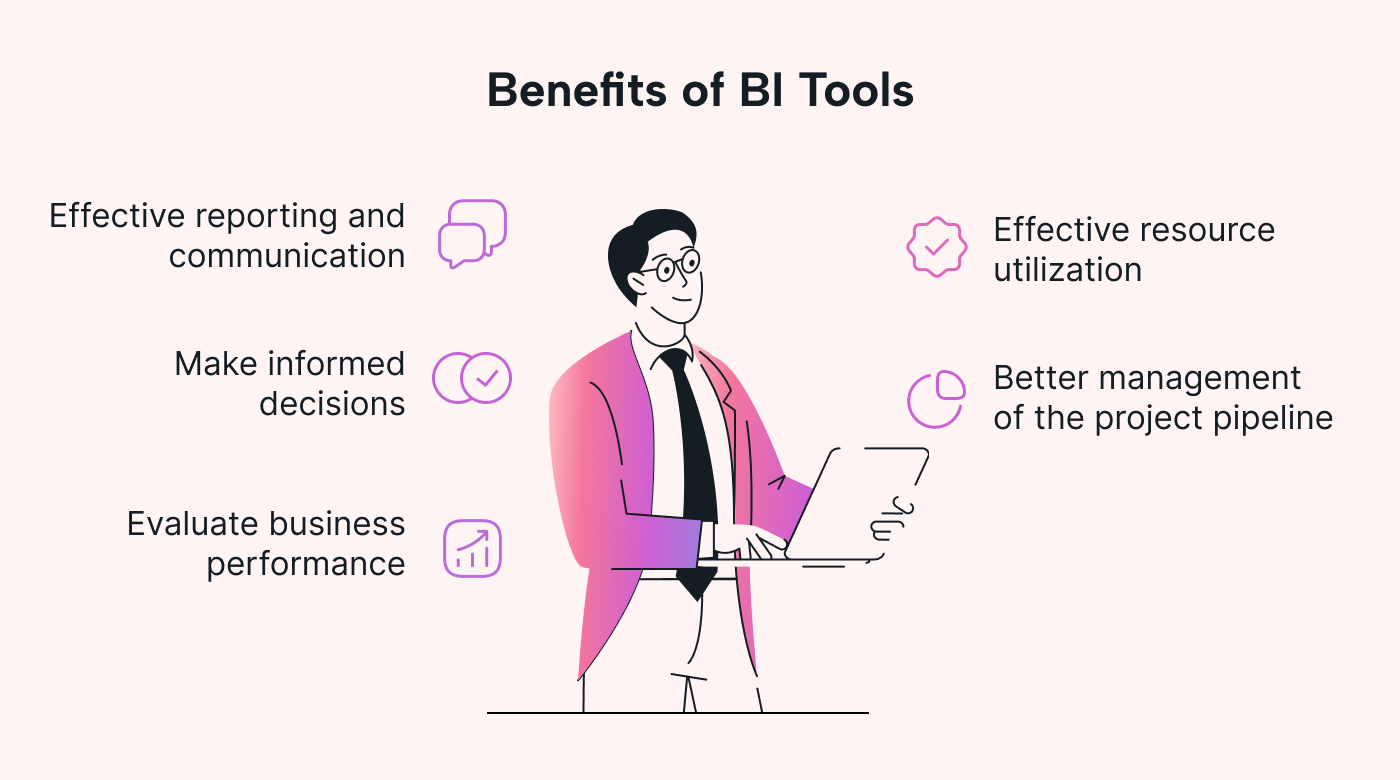 |
Evaluate business performance
BI offers a reproducible way of comparing business performance to predetermined metrics and KPIs. Businesses can also use BI tools to measure their performance in specific areas. For example, the BI team can run analytics on the number of customers visiting a website. The analytics may also include how long visitors spend on websites and which pages they click.
Effective resource utilization
Project managers and small business owners can implement BI-enabled resource management. The goal is to improve resource utilization and reduce waste. BI tools allow managers to track resource availability and utilization. They can also compare resource capacity vs. demand.
Better management of the project pipeline
Most businesses undertake multiple projects or tasks at the same time. Not all tasks share the same priority or value to the company. BI allows businesses to identify which tasks to prioritize based on urgency, impact, and market dynamics. Companies can then allocate the most resources to the most important projects.
Common challenges businesses face when using BI tools
Many businesses struggle to implement an effective BI function. Such businesses miss out on the benefits of integrating BI tools to analyze company data. Below are some possible explanations why your business has yet to experience BI's benefits.
Producing relevant reports for each stakeholder
BI reports are often goal-specific. They are intended to inform top-level managers or stakeholders about a specific issue. This means a BI executive report may be relevant to one manager but not to another. As such, the BI team may have to prepare a separate report for each group, which may be time-consuming.
Consolidating data from multiple sources
The primary benefit of BI is that businesses can consolidate data from different sources. However, this comes as both a blessing and a curse. On the one hand, consolidating data provides a more comprehensive outlook on an issue. It allows managers to see the bigger picture during decision-making. However, combining data from different sources has its dangers. First, the data may come in different formats. This may slow down the BI process as the team organizes the data.
Data quality issues
Data quality is king when discussing business intelligence. Poor-quality data often leads to inaccurate analytics. The effect is skewed results that may misguide decision-making. Common causes of data quality issues in BI include:
- Human error
- Different units of measurement
- Duplicate data
- Incomplete fields
 |
Knowledge gaps about BI tools
Understanding the concept of business intelligence is important to running a successful BI project. Unfortunately, most companies have not empowered their employees to use BI tools. According to a recent survey, 29% of employees stated that the data literacy training they received was irrelevant to their roles. Companies must provide proper training for fast BI adoption and implementation.
Related cost implications
It is expensive to integrate BI into company functions. This is a major challenge for small businesses and explains why only large companies tend to benefit from BI. Though expensive, small businesses should embrace BI to accrue its long-term benefits.
What to consider when choosing business intelligence tools
There are at least a dozen BI tools available on the market today. However, not every BI tool is suitable for your company. Project managers and small business owners should compare different BI tools and choose the best-fit option for their business functions. Below are some tips to keep in mind when comparing BI tools.
Compatibility with other systems and processes
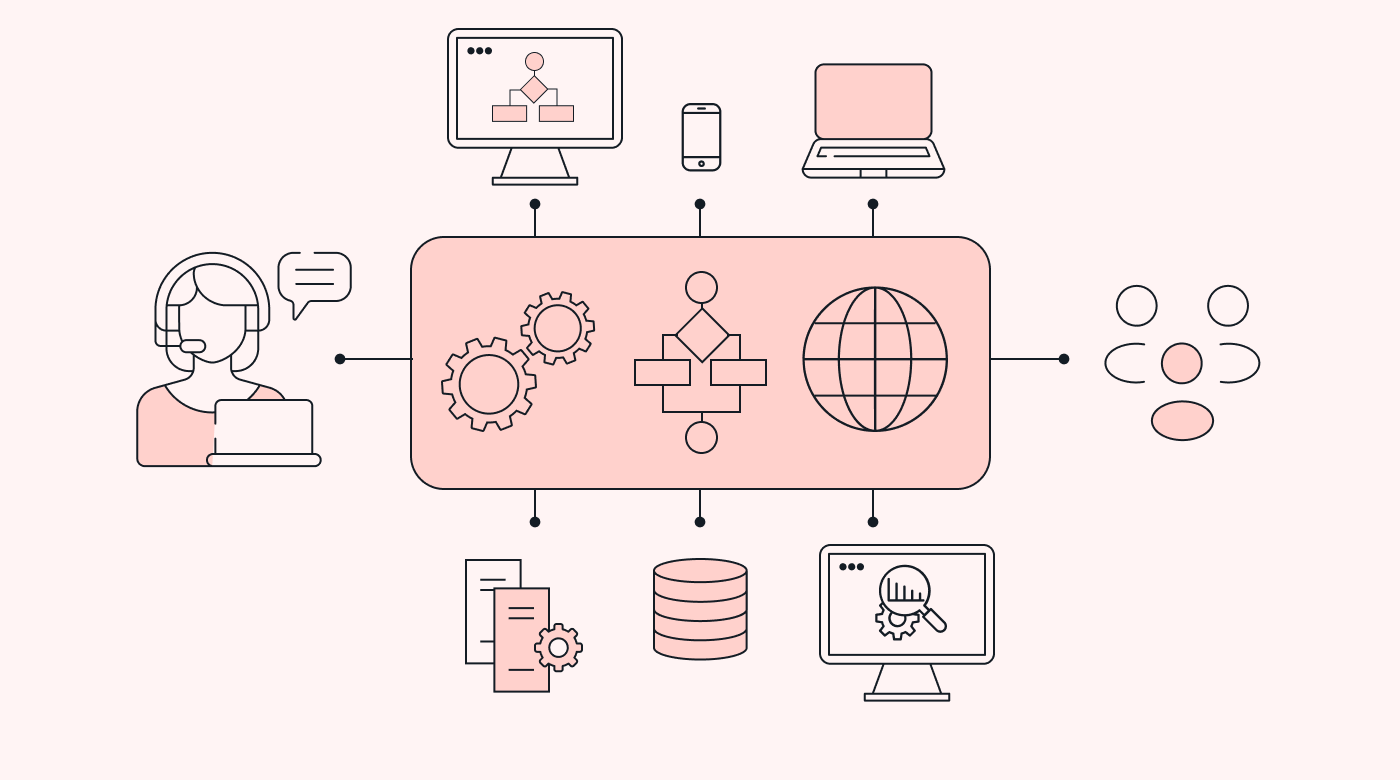
Most businesses already have existing systems and processes aligned with their operations. Introducing BI tools often requires modifying systems and restructuring processes to accommodate BI tools. Businesses should choose BI tools that pose the least disruption to company activities.
 |
Access to self-service analytics
Self-service BI tools' primary goal is to give decision-makers real-time insights about the company and the market. The feature allows users to run BI analytics tools and generate executive reports even without a data analytics background.
Operating costs
Implementing a BI function within a company is often capital-intensive. Moreover, businesses must account for both one-time and recurrent costs. Companies must decide whether to adopt traditional or self-service BI tools. One advantage of self-service BI tools is you don’t have to establish a BI team to run analytics. This often saves the company money in the long term.
The 5 best business intelligence tools
Given that there are at least a dozen BI tools, small business owners may wonder which option to choose. We review the top 5 best BI visualization tools, highlighting their unique features, pros, and cons. Let’s get to it!
Microsoft Power BI
Power BI is a data analytics and visualization software by Microsoft. It provides a centralized hub for aggregating, analyzing, and sharing data. A huge selling point for Microsoft regarding Power BI is its seamless integration with other Microsoft products, including Microsoft 365.
According to a study commissioned by Microsoft through Forrester Consulting, businesses should expect to break even in less than six months. The results also show that most businesses using Power BI experience an average of 381% return on investment in the first three years of using the tool.
Subscription cost:
$10 per user/month
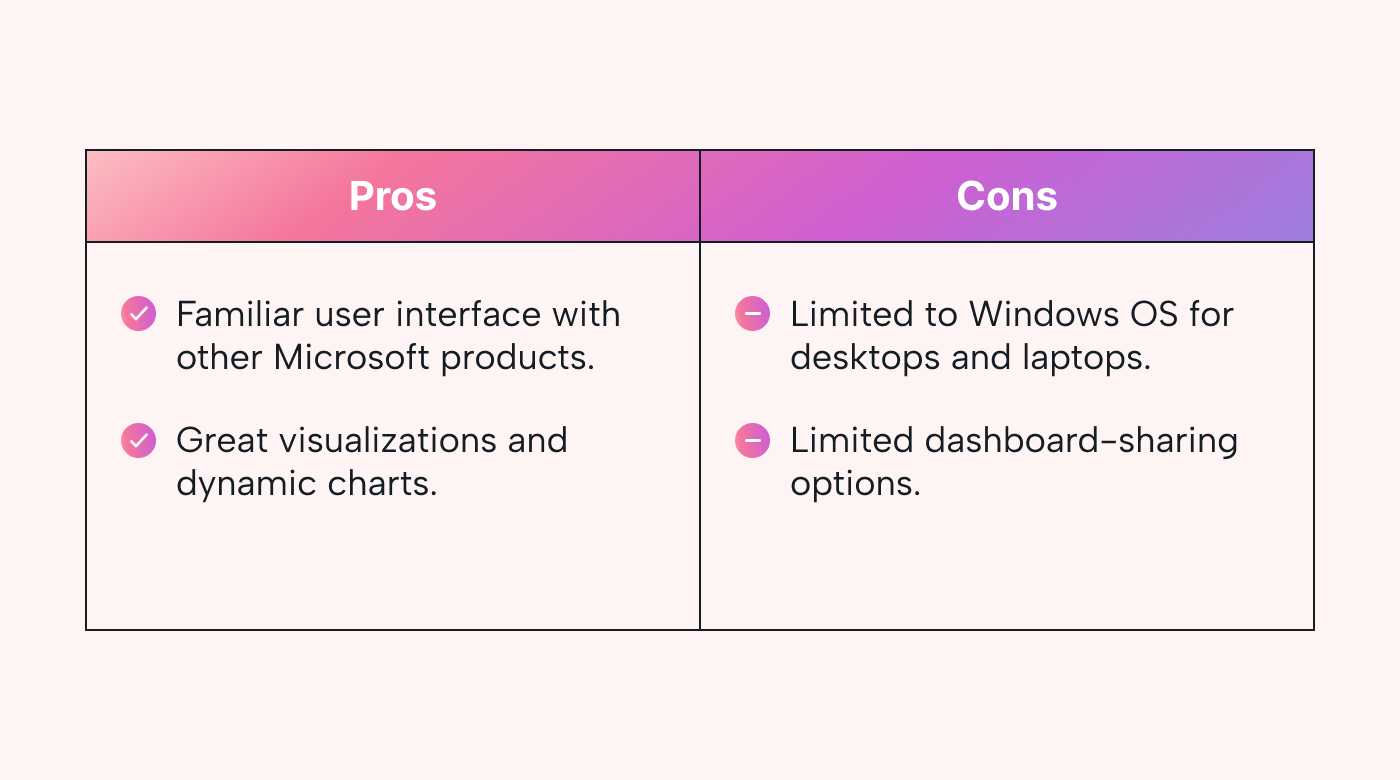 |
Dundas BI
Dundas BI is a data visualization software that provides customizable and scalable analytics. Businesses can tailor the Dundas BI dashboard only to include the features they use. A major selling point that Dundas uses is its BI tool’s compatibility. Companies can integrate Dundas BI with platforms like Microsoft Azure, Google Analytics, and Salesforce.com. Moreover, Windows, Mac OS, and Linux devices can use Dundas BI. Other notable features of Dundas BI include:
- Administration over smartphone, PC, and web interfaces
- Ad-hoc reporting capabilities
- Report scheduling and publishing
- Data discovery and modeling
- Multi-user support and access control
Subscription cost:
Dundas prices its BI tool on a per-case basis.
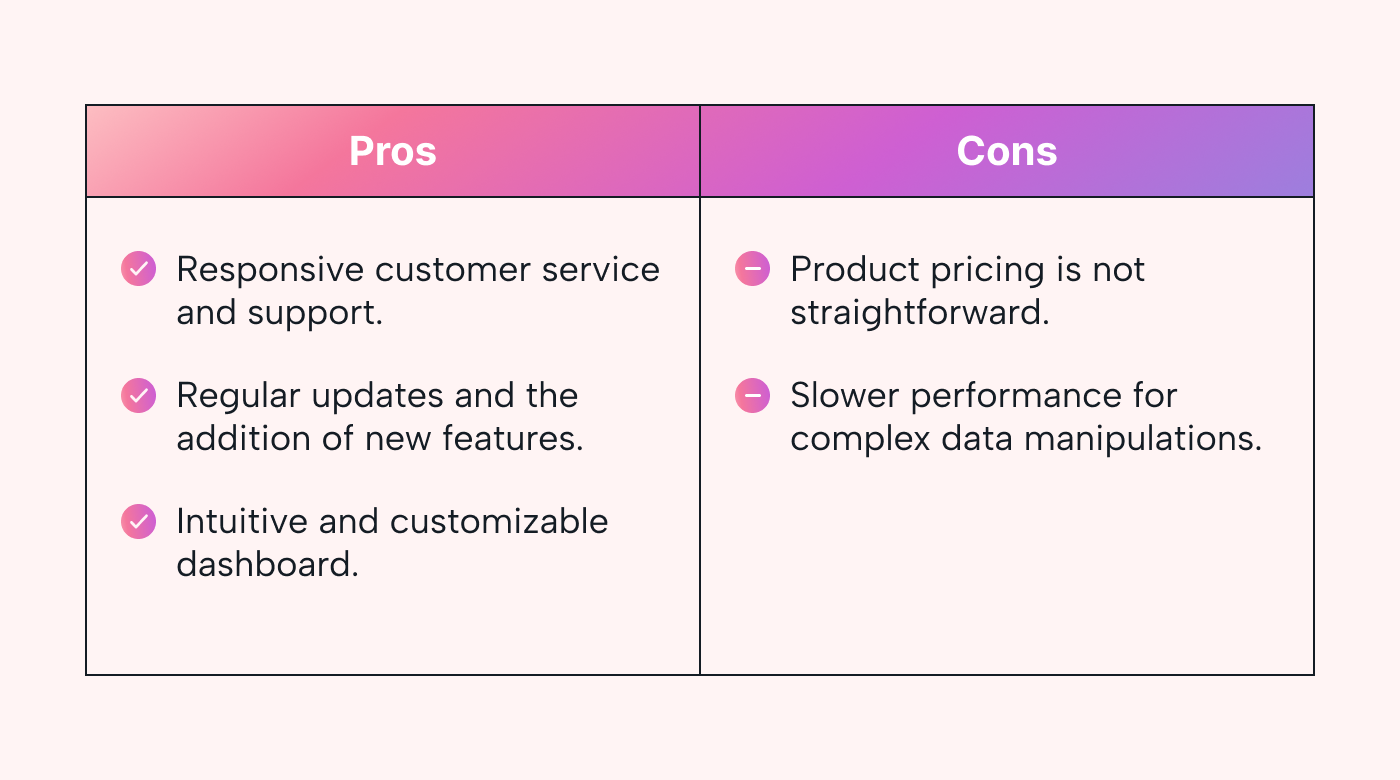 |
QlikSense
QlikSense is an AI-powered BI tool that helps businesses get insight into their operations and market dynamics. The company understands that cognitive bias is a huge hindrance to effective analytics and decision-making.
A huge selling point for QlikSense is its conversational analytics. It allows businesses to extract data from conversations with their clients or chatbots. Businesses can then leverage the BI report to identify their strengths and weaknesses regarding client relationship management.
Other features include:
- Administration over smartphone, PC, and web interfaces
- Ad-hoc reporting capabilities
- Report scheduling and publishing
- Data discovery and modeling
- Multi-user support and access control
Subscription cost:
- Qlik Sense Business: $30 per user/month
- Qlik Sense Enterprise SaaS: On a per-case basis
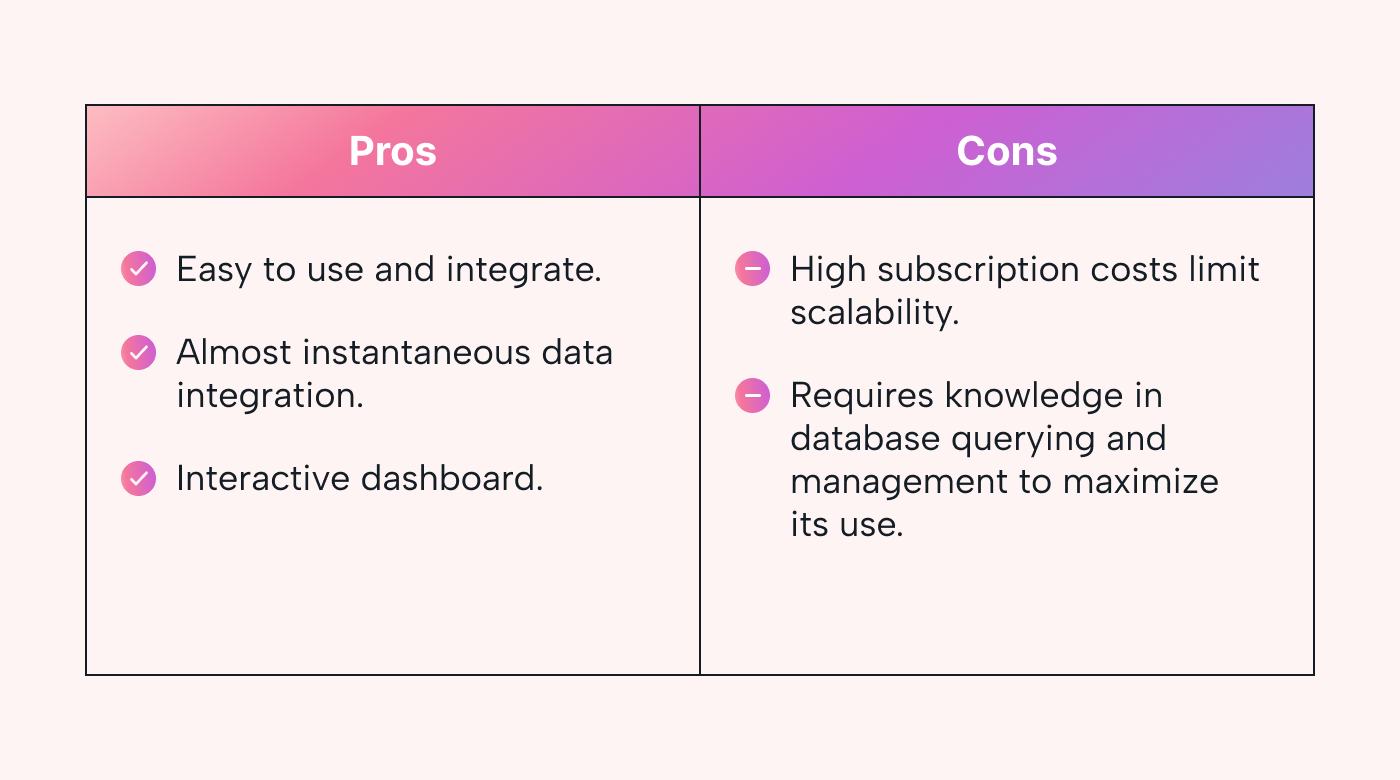 |
Tableau
Tableau is among the most versatile BI tools for data analytics and visualization. The company boasts that its BI analytics platform has the broadest integration options. You can use Tableau in the cloud, with native data connectors, or integrate it with other Tableau partners.
This BI tool has a drag-and-drop function. This is handy for small business owners without a background in business intelligence. Another huge selling point for Tableau is that you can blend datasets from different sources and use them to generate a harmonized report.
Subscription cost:
- $70 per creator per month
- Tableau bills an additional $42 and $15 monthly for explorer and viewer access, respectively
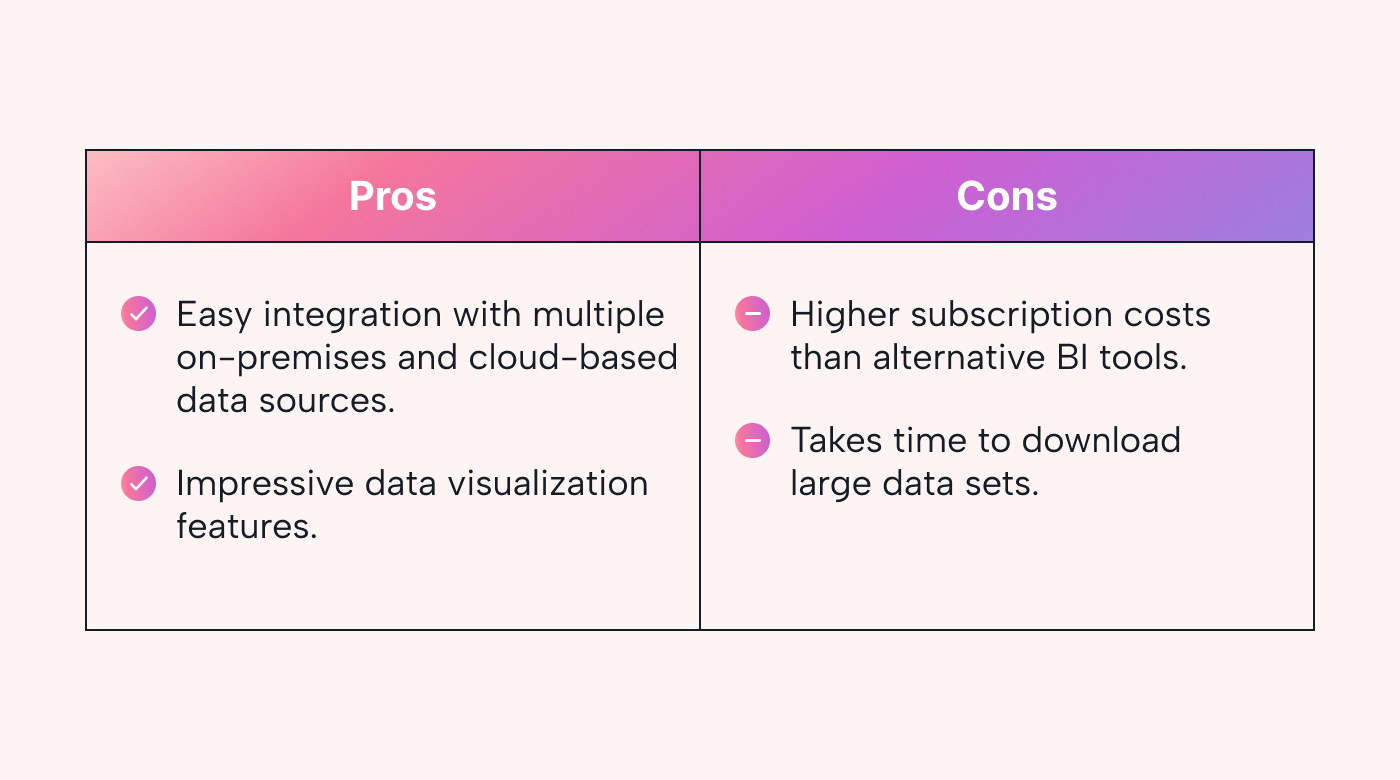 |
SAP BusinessObjects
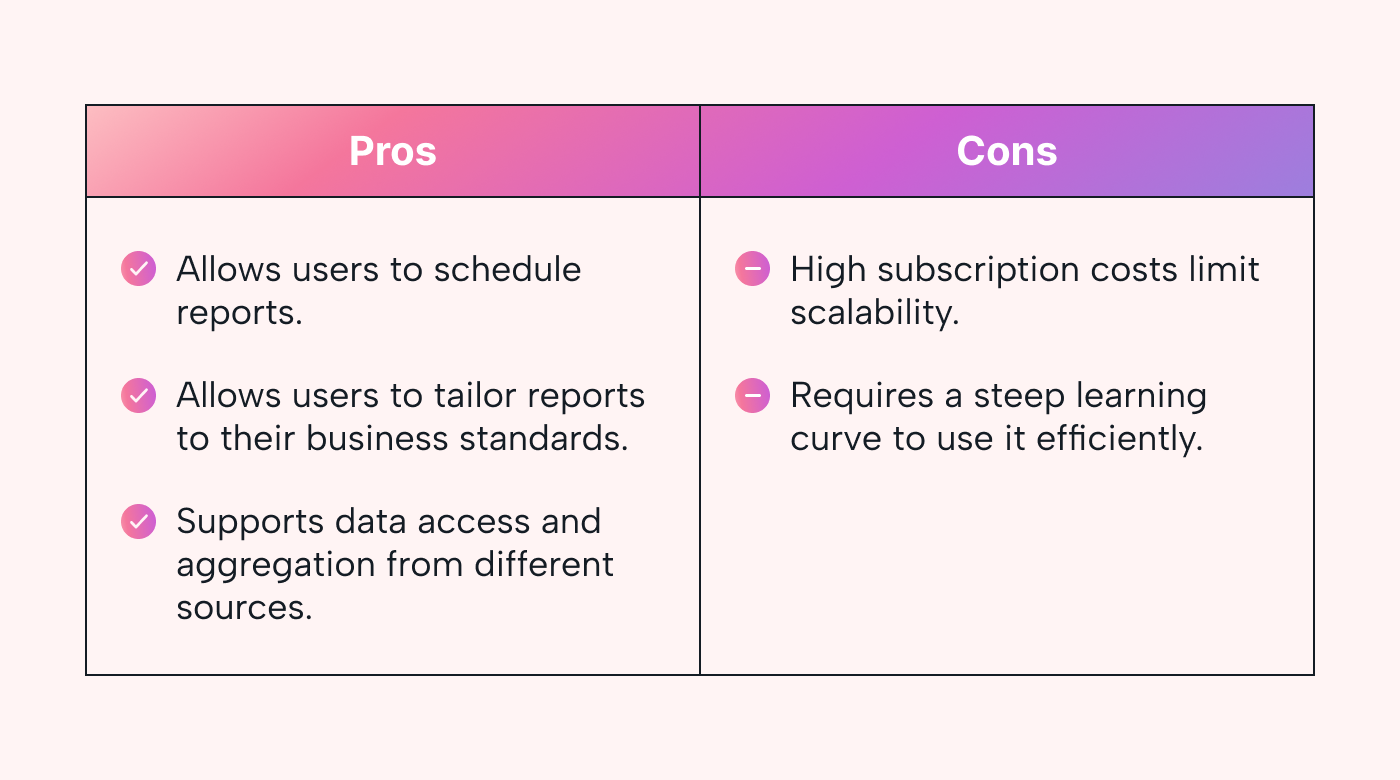
The SAP BusinessObjects is a scalable BI platform that allows companies to receive real-time insights to back their decisions. It provides a centralized data hub for organizing, analyzing, visualizing, reporting, and sharing data. SAP BusinessObjects is among the few BI tools that support integration with on-premises, cloud-based, and hybrid data sources.
A huge selling point for SAP is that its BI tool allows businesses to aggregate data from different sources and analyze it to get a more comprehensive view of a problem. Beyond the root cause analysis, this BI tool allows companies to get insights into addressing the inefficiencies to improve performance.
Subscription cost:
- SAP prices its BI tool on a per-case basis
 |
Change the way you run your business using BI tools
Small businesses can reduce their failure risk by relying on BI tools to make data-driven decisions. Companies can use BI tools to analyze past failures and identify feasible solutions. They can also analyze current market dynamics to predict future trends.
We encourage project managers and small business owners to integrate BI tools with their project management software to speed up the decision-making process. For example, individuals using Motion can rely on BI tools to determine task urgency and priority. They can then mark urgent tasks on their calendars.
Project managers can also use BI tools to identify project risks and run solution models. The recommended solutions can then be communicated to relevant stakeholders and project team members through Motion.
Try Motion for free today!

